Quantcast
Channel: SCN : Blog List - SAP Business Warehouse
Viewing all 333 articles
Browse latest View live

RSAR, E0 errors after system refresh or BDLS

$
0
0

Dear Followers


Over the past weeks we are seeing many incidents being opened by BW customers wich performed one system refresh, or one BDLS procedure.

The cause for this issue is that the connection between source system and BW target system were not done properly. And the a lot of different error messages can occur. So I created on KBA with all possible error messages and the solution of each one.

So I think that it can be relevant for all of us.


2005372 - Error messages after system refresh procedure (RSAR, E0)


I hope it helps


Janaina Steffens


Process Chains triggering through Macro in Excel

$
0
0

Process Chains triggering through Macro in Excel

I have got requirement recently working on the Excel based process chains. Everyday new records will be added into the excel sheets and we need to trigger all these files into the BW server through process chain automatically. As we have all these Excel files in the desktop.

I found the solutions

1. Save the files in AL11 (SAP Directories) by using the below function modules.

ARCHIVFILE_CLIENT_TO_SERVER

ARCHIVFILE_SERVER_TO_CLIENT

If we use the above FM you have develop the ABAP program in SE38.


2. Writing the logic in Excel Macro. (No need ABAP Program)

Select the excel sheet go to view menu -> select the Marco -> click on Marco->

Create the new Macro -> give the new Macro name -> select Macro

Next screen will appear.


Sub saveSheetsAsCSV()

Dim i As Integer

Dim fName As String

Application.DisplayAlerts = False

For i = 1 To Worksheets.Count

fName = "D:\usr\sap\DEV\DVEBMGS03\work\STAFFING_PROJECT\ " & i

ActiveWorkbook.Worksheets(i).SaveAs Filename:=fName, FileFormat:=xlCSV

Next i

End Sub


above code will convert xls format to csv format automatically while running the Macro by user

user will update the excel sheets and every day they will run the Macros

It will automatically overwrite the records while running the Macro in excel.

We saved the excel sheet in AL11 – SAP Directories.

Check the data source path – AL11 Directories


Note:- I am not explaining the how to create the DSO, CUBE, Process chains.

Please look at the Process chains daily scheduling.

Process chain triggered daily once a day and every day it will load full. I used the delete PSA request and

delete data target content form cube before loading to cube

Check the daily scheduling

in start process i given the time every morning 6:00 AM.


Hope it will help.

Thanks,

Phani.

What is SAP Early Watch Alert

$
0
0

Introduction


                 Anything in this World requires General/Critical maintenance to increase the survival. I will take two Classic examples here, to make you more clear about What I am going to talk about in this blog. One is Human body and another one is Vehicle. Both require regular Check-ups/Maintenance to have long life. Similarly, all our SAP Systems require regular Check-Ups and General/Critical Maintenance to keep them lively. You will find interesting sections below which could be produced by EWA. I am gong to show only very important sections but not everything. Let's jump into EWA now.


  • An SAP EWA can be produced by SOLMAN, which is nothing but Solution Manager
  • It can be generated on Weekly basis to keep an eye on whole Production System status
  • I am using the same terms which SAP uses in the report and you could find explanations for some of them in brackets
  • I am highlighting Column headers and imagine your configuration details in those tables to make sense
  • My intention is to show you What all parameters(Column Headers) will SAP EWA consider
  • There will be multiple sections describing about your Hardware details
  • Report starts with all Hardware and Software information precisely for BASIS administrators (as well as for BW guys for Knowledge sake)
  • Lower part of the report is for BI Developers/Support Guys which talks about Largest Aggregates etc.,


Your report heading would be like Early Watch Alert - BI_SYSTEM_LANDSCAPE


It gives a complete high level overview of your BW system with ratings on various parameters


TopicSub TopicRating
Performance OverviewPerformance EvaluationEg: Green Tick Mark
SAP System OperatingProgram Errors (ABAP Dumps)
Update Errors
Hardware Capacity
Database PerformanceMissing Indexes
BW ChecksBW Administration & Design
BW Reporting & Planning
BW Warehouse Management
SecuritySAP Security Notes: ABAP and Kernel Software Corrections
Users with Critical Authorizations
JAVA System DataJava Workload Overview
Java Application Performance


Service Summary


Performance Indicators for Production BW (System Name)


Area IndicatorsValueTrend
System PerformanceActive Users (>400 steps)
Avg. Availability per Week
Avg. Response Time in Dialog Task
Max. Dialog Steps per Hour
Avg. Response Time at Peak Dialog Hour
Avg. Response Time in RFC Task
Max. Number of RFCs per Hour
Avg. RFC Response Time at Peak Hour
Hardware CapacityMax. CPU Utilization on Appl. Server
Database PerformanceAvg. DB Request Time in Dialog Task
Avg. DB Request Time for RFC


Landscape

1) Products and Components in current Landscape


Product

SIDSAP ProductSAP Product Version
SAP NetWeaver     Eg: 3.5 / 7.0 / 7.3


Main Instances (ABAP or Java based)

SIDMain Instance
Eg: Application Server JAVA
Eg: Enterprise Portal


Databases

SIDDatabase SystemDatabase Version
Eg: Oracle, MS-SQL, HANA etc,


2) Servers in current Landscape


SAP Application Servers (If you have multiple servers, those will be listed down below)

SIDHostInstance NameLogical HostABAPJAVA


DB Servers

SIDHostLogical Host( SAPDBHOST)


Components

Related SIDComponentHostInstance NameLogical Host


3) Hardware Configuration


Host Overview

HostCPU TypeOperating SystemNo. of CPUsMemory in MB


ST-PI and ST-A/PI Plug-Ins. This will indicate you to update to the latest levels.


RatingPlug-InReleasePatch LevelRelease RecPatch Level Rec
ST-A/PI


Software Configuration For your Production System


SAP Product VersionEnd of Mainstream MaintenanceStatus
Eg: SAP NetWeaver Version 7.0                   31.12.2017


Support Package Maintenance - ABAP.


This info can be found in your BW System via System-->Status, except Latest Available Patch Level Info. Below table indicates us to update to latest Patches.

Software ComponentVersionPatch LevelLatest Avail. Patch LevelSupport PackageComponent Description


Support Package Maintenance - JAVA

ComponentVersionSPLatest Available SP


Database - Maintenance Phases

Database SystemDatabase VersionEnd of Standard Vendor Support*CommentEnd of Extended Vendor Support*CommentStatusSAP Note
1177356


Similar table for your Operating System also.


SAP Kernel Release. You can find this via System-->Status

Instance(s)SAP Kernel ReleasePatch LevelAge in MonthsOS Family


They indicate you to update to latest Support Package Stack for your Kernel Release, if required.


Overview System (your SID)


General

This analysis basically shows the workload during the peak working hours (9-11, 13) and is based on the hourly averages.


CPU

If the average CPU load exceeds 75%, temporary CPU bottlenecks are likely to occur. An average CPU load of more than 90% is a strong indicator of a CPU bottleneck.


Memory

If your hardware cannot handle the maximum memory consumption, this causes a memory bottleneck in your SAP system that can impair performance.


Workload Overview (Your SID)


  • Workload By Users
  • Workload By Task Types Eg: RFC, HTTP(S)

Th above information will be given in fantastic graphical presentation by SAP.You can make out good sense out of them.


BW Checks for (Your SID)


BW - KPIs : Some BW KPIs exceed their reference values. This indicates either that there are critical problems or that performance, data volumes, or administration can be optimized.


KPIDescriptionObservedReferenceRatingRelevant for Overall Service Rating
Nr of Aggregates recommended to deleteEg: 25Eg: 13Yellow


This indicates all Zero calls Aggregates can be deleted.


Program Errors (ABAP Dumps)


This section shows the ABAP Dumps(ST22) which have occurred in the last week. They will suggest us to monitor on a regular basis and we should determine the possible causes asap. Eg : CX_SY_OPEN_SQL_DB


Users with Critical Authorizations


This section suggests us to review all our Authorization Roles and Profiles on a regular basis. for additional info SAP Note : 863362


Missing Indexes


This section indicates us to have an eye on whether Primary indexes are exists on the tables in database. Because, missing indexes can lead to severe performance issues.


Data Distribution


Largest InfoCubes : We should make sure we do Compression on a regular basis.


InfoCube Name# Records


Largest Aggregates : Large Aggregates high run times for Roll ups and Attribute Change runs. So we should check them periodically and modify them at least on quarterly basis.


InfoCubeAggregate Name# Records


Analysis of InfoProviders : This table basically shows the Counts


Info ProvidersBasis CubesMulti ProvidersAggregatesVirtual CubesRemote CubesTransactional CubesDSO ObjectsInfo ObjectsInfo Sets


DSO Objects : This table basically shows the Counts


# DSO Objects# DSO Objects with BEX flag# DSO Objects with unique flag# Transactional DSO Objects


InfoCube Design of Dimensions : You can check this by running SAP_INFOCUBE_DESIGNS in SE38


InfoCube# rowsMax % entries in DIMs compared to F-table


Aggregates Overview : We can take a call to delete unused Aggregates by observing this table


#Aggregates#Aggregates to consider if to be deleted#Aggregates with 0 calls#Basis Aggregates


Aggregates to be considered for deletion (Most important Section to take a quick action)


Cube nameAggr.-cube# entriesAvg. reduce factor# callsCreated atLast Call# Nav. Attr.# Hier.


DTP Error Handling : You can deactivate error stack if you don't expect errors often. It's better to use "No Update No Reporting" option.


# DTPs with error handling# Total DTPs% of DTPs with error handling


BW Statistics


All your BI Admin Cockpit information will be provided in detailed tabular presentation about OLAP Times, Run time etc., Many tables will be there for every aspect which I cannot show you in this blog, as it is already too big now


Conclusion


"SAP Early Watch Alert" gives us a complete picture of our BW System in all aspects. This is a fantastic service gives by SAP to keep us alert before any damage happens to the system. I have tried to show you almost all important things in this blog.

Federation vs. Data Warehousing

$
0
0

Just recently, I got dragged - yet again - into a debate on whether data warehousing is out-dated or not. I tried to boil it down to one amongst many problems that data warehousing solves. As that helped to direct the discussion into a constructive and less ideological debate, I've put it into this short blog.

The problem is trivial and very old: as you need data from multiple sources why not accessing the data directly in those sources whenever needed! That guarantees real-time. Let's assume that the sources are powerful, network bandwidths at the top of technology and overall query performance be excellent. So: why not? In fact, this is absolutely valid but there is one more thing to consider, namely that all sources to be accessed need to be available. What is the mathematical probability for that? Even small analytic systems (aka data marts) access 30, 40, 50 data sources. For bigger data warehouses this goes to the 100s. That does not mean that every query accesses all those sources but naturally a significantly smaller subset. However, from an admin perspective it is clearly not viable to continuously translate source availability to query availability. One must assume that end users would want to access all sources continuously as it is required.

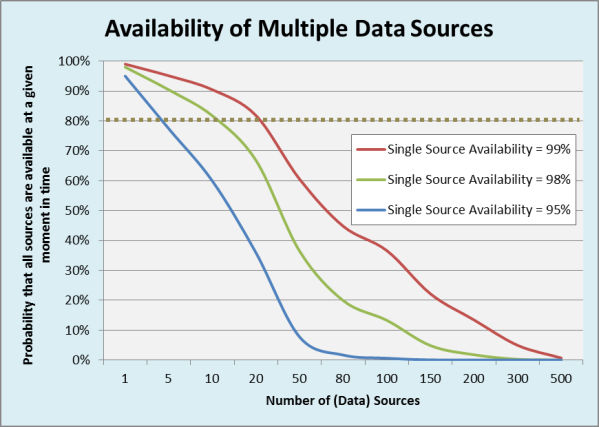
Figure 1 pictures 3 graphs that show the probability of all sources (= all data) being available, depending on the average availability of a source. For the latter 99%, 98% and 95% were considered to cater for planned and unplanned downtimes, network and other infrastructure failures. Even if a service-level agreement (SLA) of 80% availability (see dotted line) is assumed, it becomes obvious that such an SLA can be achieved only for a modest number of sources. N.b. that this applies even when data is synchronously replicated into an RDBMS because replication will obviously fail if the source is down or not accessible.


Fig. 1: Probability that all (data) sources are available given an average availability for a single source.


In a data warehouse (DW), this problem is addressed by regularly and asynchronously copying (extracting) data from the source into the DW. This is a controlled, managed and monitored process that can be made transparent to the admin of a source system who can  then cater for downtimes or any other non-availability of his system. As such, a big problem for one admin - i.e. availability of allsources - is broken down to smaller chunks that can be managed in a simpler, de-central way. Once, the data is in the DW, it is available independent from planned / unplanned downtimes or network failures of the source systems.

Please do not read this blog as a counter argument to federation. No, I simply intend to create awareness for an instance that is solved by a data warehouse and that must not be under-estimated or neglected.

This blog has been cross-published here. You can follow me on Twitter under @tfxz.

DTP loads Vs. ODS activation - a comparative Study

$
0
0

Hi All,


This blog will help you in understanding the relation between DTP loads and ODS request activation in a technical perspective.


ODS request activation will be similar to your delta DTP loads where the delta requests(requests which are not activated) available in the source(New Table) will be processed to target(Active & Change log table) based on Request ID.


Source and Target : DSO activation is also just similar to you DTP load processing where your New table will act as a "Source", your Active table and Change log table will acts as "Targets"

Data Package :Based on your system settings, alike the package size in your DTP settings, you'll be also having package size in DSO activation settings       (refer T-Code: RSODSO_SETTINGS) which will be used to transfer the 'n' records grouped into data packages for processing.

Parallel Processing :Parallel processing in DTP is used to process the data packages in parallel. Similarly Parallel processing in DSO activation also will works.

From the below figure(taken from the RSODSO_SETTINGS) to illustrate Data Package & Parallel Processing,

  • Package size Activation will determines the number of records to be sent in single package(from New table to Active & Change log table).
  • Number of Processes will determines the number of packages to be processed at a time.

For example, If your New table has total number of records = 1,000,000; with this settings => Package size Activation = 50,000; Number of Processes = 4, totally 20 packages (=1,000,000 /50,000) will be created and at a time 4 packages will be processed in parallel.

http://wiki.scn.sap.com/wiki/download/attachments/375128688/Package%20%26%20parallel.png?version=2&modificationDate=1399656580000&api=v2

Request by Request in Delta DTP loads and Do not condense request into Single request in DSO activation : When you select the "get delta request by request" in DTP settings, the delta requests from the source will be processed one after another and it will create separate request ID for each run. Similarly, when you select the "do not condense request into one request while activation takes place" in DSO activation settings, the multiple requests which are waiting for activation will get activated one after another and each request activation will generate new request ID.


To know more in detail about how the ODS activation is working please navigate to wiki page

Sharing even more comparisons(if any) which are missed above are much appreciated !!


Thanks,

Bharath S

Percentage Share and Percentage Share with Signed base value

$
0
0

Introduction:


This document focuses in explaining the difference between the "Percentage Share" and "Percentage Share with the Signed base value" operands present in the Business Explorer and to how to use it in BEX.


Definition:


Percentage Share (%A):    <operand 1> %A <operand 2>

This gives the percentage share of operand 1 and operand 2. It is identical to formula  (<operand 1> / abs(<operand 2>) )*100


Percentage share with Signed base value (%_A):    <operand 1> %_A <operand 2>

This gives the percentage share of operand 1 and operand 2. It is identical to formula ( <operand 1> / <operand 2> )*100

This is available under Percentage Functions in Query Designer:


Percentage.jpg


How to Apply:


Formula with %A:

Definition1.JPG


This is percentage share between JAN Budget data to Actual data.


Formula with %_A:


Definition2.JPG

Output from the BEX with %A and %_A:

Output.JPG

Where ever the actual amount is negative, %A is giving the data in Positive due to the ABS function usage where as %_A is giving the result without ABS. Developer has to choose depending on the requirement from the Customer. Few customers are interested to use the %A to show the result in Positive always when the denominator is in Negative.


Backend Tables:


The operators are maintained in the table RSZOPRATOR and RSZOPRATXT.


RSZOPRATOR.JPG

RSZOPRATXT is used to maintain the text information of the operator.


Activating %_A:


To activate this operator, use transaction SE16, select the %_A operator in the RSZOPRATOR table, go to 'Table entry  and then Create with template' and replace the Object version entry from X with an A.


With this the %_A is available in the frontend layer and can be used in BEX for calculations.


If the operator %_A is not present in table RSZOPRATOR then use %A entry as template and then make an entry for %_A and version with A and define a text for %_A in the table - RSZOPRATXT to display the text in front end.

RSAR, E0 errors after system refresh or BDLS

$
0
0

Dear Followers


Over the past weeks we are seeing many incidents being opened by BW customers wich performed one system refresh, or one BDLS procedure.

The cause for this issue is that the connection between source system and BW target system were not done properly. And the a lot of different error messages can occur. So I created on KBA with all possible error messages and the solution of each one.

So I think that it can be relevant for all of us.


2005372 - Error messages after system refresh procedure (RSAR, E0)


I hope it helps


Janaina Steffens

How to enable ad-hoc Delta Loading of Financial Accounting – Line Items

$
0
0

Introduction:


The changes in the Financial Accounting Line Items are stored in the table BWFI_AEDAT which enables the BW system to pull the Delta data using the time stamp procedure. As a standard SAP recommendations the extraction from the Financial Accounting Line Items are limited to once a day and hence ad-hoc data loads from the following extractors will bring Zero Records:


  • 0FI_GL_4  - General ledger: Line Items
  • 0FI_AP_4  - Accounts payable: Line Items
  • 0FI_AR_4  - Accounts receivable: Line Items


This document describes the procedure to activate the ad-hoc data loads which will bring the delta data from the line items from the listed data sources into BW.


Reasons:


The FI line item delta Data Sources can identify new and changed data only to the day because the source tables only contain the CPU date and not the time as time characteristic for the change. This results in a safety interval of at least one day.


The standard behavior can be changed. For more information, see note 485958. Follow the Link


Settings to activate Ad-hoc loads:


Frequent data loads into BW from Line Items will allow each extraction can be done more efficiently and this will also reduce the risk of data load failures due to the huge volume of data in the system.


Following Manual Changes in the source system has to be performed in the table – BWOM_SETTINGS:


BWFINEXT = X

BWFINSAF = 3600 (for hourly extraction)


With the change in the above parameters the Safety Interval will now depend on the flag of BWFINSAF which is defaulted to 3600 Sec (1hr). And this value can be changed depending on the requirement.

The change in the table against to BWFINSAF and BWFINEXT will lead to ignore the other flags like BWFIOVERLA, BWFISAFETY and BWFITIMBOR.


Flags BWFILOWLIM, DELTIMEST will work like before.


BWOM_SETTINGS:


BWOM_SETTINGS.JPG


Once the changes are updated in the table, the delta extraction can be initiated in BW which will bring the data loads as per the scheduling done at the Process chain or the ad-hoc manual data loads.


Note:


With the new extractor logic implemented you can change back to the standard logic any day by switching off the flag BWFINEXT to ' ' from 'X' and extract as it was before. But ensure that there is no extraction running (for any of the extractors 0FI_*_4 extractors/data sources) while switching.


On the version validity and for more information please refer to the Note: 991429


Side Effects:


There are no side effects in the current versions of ECC but if the source system is of older version like SAP_APPL is between 600 to 605 and 2004_1_46c to 2004_1_500 with the different patch levels then please refer to the note: 1152755 where the data extraction of the following data sources will fail:


  • 0ASSET_ATTR_TEXT
  • 0ASSET_AFAB_ATTR
  • 0FI_AA_11
  • 0FI_AA_12

This is due to Asset Accounting data sources and FI Line item data sources uses the same Function Modules to fetch and update the time stamps for extraction.


Correction specified in the note: 1152755 have to be incorporated in order to resolve the issue with the AA data sources.


References:


991429

485958

1138537

1330016

1152755


Process Chains triggering through Macro in Excel

$
0
0

Process Chains triggering through Macro in Excel

I have got requirement recently working on the Excel based process chains. Everyday new records will be added into the excel sheets and we need to trigger all these files into the BW server through process chain automatically. As we have all these Excel files in the desktop.

I found the solutions

1. Save the files in AL11 (SAP Directories) by using the below function modules.

ARCHIVFILE_CLIENT_TO_SERVER

ARCHIVFILE_SERVER_TO_CLIENT

If we use the above FM you have develop the ABAP program in SE38.


2. Writing the logic in Excel Macro. (No need ABAP Program)

Select the excel sheet go to view menu -> select the Marco -> click on Marco->

Create the new Macro -> give the new Macro name -> select Macro

Next screen will appear.


Sub saveSheetsAsCSV()

Dim i As Integer

Dim fName As String

Application.DisplayAlerts = False

For i = 1 To Worksheets.Count

fName = "D:\usr\sap\DEV\DVEBMGS03\work\STAFFING_PROJECT\ " & i

ActiveWorkbook.Worksheets(i).SaveAs Filename:=fName, FileFormat:=xlCSV

Next i

End Sub


above code will convert xls format to csv format automatically while running the Macro by user

user will update the excel sheets and every day they will run the Macros

It will automatically overwrite the records while running the Macro in excel.

We saved the excel sheet in AL11 – SAP Directories.

Check the data source path – AL11 Directories


Note:- I am not explaining the how to create the DSO, CUBE, Process chains.

Please look at the Process chains daily scheduling.

Process chain triggered daily once a day and every day it will load full. I used the delete PSA request and

delete data target content form cube before loading to cube

Check the daily scheduling

in start process i given the time every morning 6:00 AM.


Hope it will help.

Thanks,

Phani.

What is SAP Early Watch Alert

$
0
0

Introduction


                 Anything in this World requires General/Critical maintenance to increase the survival. I will take two Classic examples here, to make you more clear about What I am going to talk about in this blog. One is Human body and another one is Vehicle. Both require regular Check-ups/Maintenance to have long life. Similarly, all our SAP Systems require regular Check-Ups and General/Critical Maintenance to keep them lively. You will find interesting sections below which could be produced by EWA. I am gong to show only very important sections but not everything. Let's jump into EWA now.


  • An SAP EWA can be produced by SOLMAN, which is nothing but Solution Manager
  • It can be generated on Weekly basis to keep an eye on whole Production System status
  • I am using the same terms which SAP uses in the report and you could find explanations for some of them in brackets
  • I am highlighting Column headers and imagine your configuration details in those tables to make sense
  • My intention is to show you What all parameters(Column Headers) will SAP EWA consider
  • There will be multiple sections describing about your Hardware details
  • Report starts with all Hardware and Software information precisely for BASIS administrators (as well as for BW guys for Knowledge sake)
  • Lower part of the report is for BI Developers/Support Guys which talks about Largest Aggregates etc.,


Your report heading would be like Early Watch Alert - BI_SYSTEM_LANDSCAPE


It gives a complete high level overview of your BW system with ratings on various parameters


TopicSub TopicRating
Performance OverviewPerformance EvaluationEg: Green Tick Mark
SAP System OperatingProgram Errors (ABAP Dumps)
Update Errors
Hardware Capacity
Database PerformanceMissing Indexes
BW ChecksBW Administration & Design
BW Reporting & Planning
BW Warehouse Management
SecuritySAP Security Notes: ABAP and Kernel Software Corrections
Users with Critical Authorizations
JAVA System DataJava Workload Overview
Java Application Performance


Service Summary


Performance Indicators for Production BW (System Name)


Area IndicatorsValueTrend
System PerformanceActive Users (>400 steps)
Avg. Availability per Week
Avg. Response Time in Dialog Task
Max. Dialog Steps per Hour
Avg. Response Time at Peak Dialog Hour
Avg. Response Time in RFC Task
Max. Number of RFCs per Hour
Avg. RFC Response Time at Peak Hour
Hardware CapacityMax. CPU Utilization on Appl. Server
Database PerformanceAvg. DB Request Time in Dialog Task
Avg. DB Request Time for RFC


Landscape

1) Products and Components in current Landscape


Product

SIDSAP ProductSAP Product Version
SAP NetWeaver     Eg: 3.5 / 7.0 / 7.3


Main Instances (ABAP or Java based)

SIDMain Instance
Eg: Application Server JAVA
Eg: Enterprise Portal


Databases

SIDDatabase SystemDatabase Version
Eg: Oracle, MS-SQL, HANA etc,


2) Servers in current Landscape


SAP Application Servers (If you have multiple servers, those will be listed down below)

SIDHostInstance NameLogical HostABAPJAVA


DB Servers

SIDHostLogical Host( SAPDBHOST)


Components

Related SIDComponentHostInstance NameLogical Host


3) Hardware Configuration


Host Overview

HostCPU TypeOperating SystemNo. of CPUsMemory in MB


ST-PI and ST-A/PI Plug-Ins. This will indicate you to update to the latest levels.


RatingPlug-InReleasePatch LevelRelease RecPatch Level Rec
ST-A/PI


Software Configuration For your Production System


SAP Product VersionEnd of Mainstream MaintenanceStatus
Eg: SAP NetWeaver Version 7.0                   31.12.2017


Support Package Maintenance - ABAP.


This info can be found in your BW System via System-->Status, except Latest Available Patch Level Info. Below table indicates us to update to latest Patches.

Software ComponentVersionPatch LevelLatest Avail. Patch LevelSupport PackageComponent Description


Support Package Maintenance - JAVA

ComponentVersionSPLatest Available SP


Database - Maintenance Phases

Database SystemDatabase VersionEnd of Standard Vendor Support*CommentEnd of Extended Vendor Support*CommentStatusSAP Note
1177356


Similar table for your Operating System also.


SAP Kernel Release. You can find this via System-->Status

Instance(s)SAP Kernel ReleasePatch LevelAge in MonthsOS Family


They indicate you to update to latest Support Package Stack for your Kernel Release, if required.


Overview System (your SID)


General

This analysis basically shows the workload during the peak working hours (9-11, 13) and is based on the hourly averages.


CPU

If the average CPU load exceeds 75%, temporary CPU bottlenecks are likely to occur. An average CPU load of more than 90% is a strong indicator of a CPU bottleneck.


Memory

If your hardware cannot handle the maximum memory consumption, this causes a memory bottleneck in your SAP system that can impair performance.


Workload Overview (Your SID)


  • Workload By Users
  • Workload By Task Types Eg: RFC, HTTP(S)

Th above information will be given in fantastic graphical presentation by SAP.You can make out good sense out of them.


BW Checks for (Your SID)


BW - KPIs : Some BW KPIs exceed their reference values. This indicates either that there are critical problems or that performance, data volumes, or administration can be optimized.


KPIDescriptionObservedReferenceRatingRelevant for Overall Service Rating
Nr of Aggregates recommended to deleteEg: 25Eg: 13Yellow


This indicates all Zero calls Aggregates can be deleted.


Program Errors (ABAP Dumps)


This section shows the ABAP Dumps(ST22) which have occurred in the last week. They will suggest us to monitor on a regular basis and we should determine the possible causes asap. Eg : CX_SY_OPEN_SQL_DB


Users with Critical Authorizations


This section suggests us to review all our Authorization Roles and Profiles on a regular basis. for additional info SAP Note : 863362


Missing Indexes


This section indicates us to have an eye on whether Primary indexes are exists on the tables in database. Because, missing indexes can lead to severe performance issues.


Data Distribution


Largest InfoCubes : We should make sure we do Compression on a regular basis.


InfoCube Name# Records


Largest Aggregates : Large Aggregates high run times for Roll ups and Attribute Change runs. So we should check them periodically and modify them at least on quarterly basis.


InfoCubeAggregate Name# Records


Analysis of InfoProviders : This table basically shows the Counts


Info ProvidersBasis CubesMulti ProvidersAggregatesVirtual CubesRemote CubesTransactional CubesDSO ObjectsInfo ObjectsInfo Sets


DSO Objects : This table basically shows the Counts


# DSO Objects# DSO Objects with BEX flag# DSO Objects with unique flag# Transactional DSO Objects


InfoCube Design of Dimensions : You can check this by running SAP_INFOCUBE_DESIGNS in SE38


InfoCube# rowsMax % entries in DIMs compared to F-table


Aggregates Overview : We can take a call to delete unused Aggregates by observing this table


#Aggregates#Aggregates to consider if to be deleted#Aggregates with 0 calls#Basis Aggregates


Aggregates to be considered for deletion (Most important Section to take a quick action)


Cube nameAggr.-cube# entriesAvg. reduce factor# callsCreated atLast Call# Nav. Attr.# Hier.


DTP Error Handling : You can deactivate error stack if you don't expect errors often. It's better to use "No Update No Reporting" option.


# DTPs with error handling# Total DTPs% of DTPs with error handling


BW Statistics


All your BI Admin Cockpit information will be provided in detailed tabular presentation about OLAP Times, Run time etc., Many tables will be there for every aspect which I cannot show you in this blog, as it is already too big now


Conclusion


"SAP Early Watch Alert" gives us a complete picture of our BW System in all aspects. This is a fantastic service gives by SAP to keep us alert before any damage happens to the system. I have tried to show you almost all important things in this blog.

Few design considerations for NEW GL reporting in SAP BW

$
0
0

The following are the few design considerations when reporting for New General Ledger Accounting module is implemented in SAP BW. This is applicable for the following data sources.


0FI_GL_10           General Ledger: Balances, Leading Ledger

3FI_GL_xx_TT      General Ledger (New): Balances from Any Ledgers (Generated)

0FI_GL_14           General Ledger Accounting (New): Line Items of the Leading Ledger

3FI_GL_XX_SI      General Ledger Accounting (New): Line Items of Any Ledger (Generated)


Factors / Delta Methods

AIED

ADD

ADDD

DSO

Mandatory

Not required

Not required

Update type for key figures

Over write

Addition (if DSO is used)

Addition (if DSO is used)

Data load performance

Considerable performance problems if a large number of totals records are added or changed between two delta transfers. In particular, performance can drop dramatically when the balance carry forward or mass postings are executed during the year-end closing activities.

Good performance if there are large data volumes

Very good performance if there are large data volumes

Data volume

Relatively high data volumes are transferred to BW.

Relatively low data volume is transferred to BI

Since the data is aggregated only in a logical unit of work (LUW) for totals records, the data volume transferred to BI is usually greater than the volume transferred during the method ADD

ECC downtime during delta initialization

Not required

A posting-free period must be ensured in ECC

A posting-free period must be ensured in ECC

Planning data in delta mode

Planning data can be extracted in delta mode

No planning data can be extracted in delta mode

No planning data can be extracted in delta mode. (However , this can be enabled using a modification with SAP note)

Key figure 0BALANCE

Data is available by default

It has to be calculated in start routine in BW.  The prerequisite for using this method is that line items are written in period 0.

It has to be calculated in start routine in BW

Data availability in BW

Data in BW is current

1 hour latency. Upper safety interval of an hour, that is, only line items that are MORE THAN ONE HOUR OLD are transferred to BI. This safety interval is NOT allowed to be reduced because this would risk posting records being lost during the extraction.

Data in BW is current

Additional Index in ECC

An additional secondary index is required for the totals table for the field TIMESTAMP

Additional index for the TIMESTAMP field in the line item table required

No additional index is required in the totals table or the line item table

Recommendation

This delta method can transfer only about 1,000 totals records each minute to BW. Therefore, this delta method is recommended only if a relatively low number of totals records are added or changed between two delta transfers.

For example, almost two hours are required for 100,000 extracted totals records.

If there are large data volumes, this method is faster than the method AIED described previously. It is particularly efficient if a large number of the SAME characteristic combinations are posted between two delta transfers (for example, numerous postings to the value-added tax account with the same profit center) because, in this case, the selected line items are transferred to BW in aggregated form

This method is the best alternative in most cases if there are large data volumes because of its performance advantages compared with the two other methods(AIED & ADD). The data is aggregated only in a LUW, this method is most efficient if relatively few DIFFERENT characteristic combinations are posted between two delta transfers (for example, all postings are made to different profit centers)

Federation vs. Data Warehousing

$
0
0

Just recently, I got dragged - yet again - into a debate on whether data warehousing is out-dated or not. I tried to boil it down to one amongst many problems that data warehousing solves. As that helped to direct the discussion into a constructive and less ideological debate, I've put it into this short blog.

The problem is trivial and very old: as you need data from multiple sources why not accessing the data directly in those sources whenever needed! That guarantees real-time. Let's assume that the sources are powerful, network bandwidths at the top of technology and overall query performance be excellent. So: why not? In fact, this is absolutely valid but there is one more thing to consider, namely that all sources to be accessed need to be available. What is the mathematical probability for that? Even small analytic systems (aka data marts) access 30, 40, 50 data sources. For bigger data warehouses this goes to the 100s. That does not mean that every query accesses all those sources but naturally a significantly smaller subset. However, from an admin perspective it is clearly not viable to continuously translate source availability to query availability. One must assume that end users would want to access all sources continuously as it is required.

Figure 1 pictures 3 graphs that show the probability of all sources (= all data) being available, depending on the average availability of a source. For the latter 99%, 98% and 95% were considered to cater for planned and unplanned downtimes, network and other infrastructure failures. Even if a service-level agreement (SLA) of 80% availability (see dotted line) is assumed, it becomes obvious that such an SLA can be achieved only for a modest number of sources. N.b. that this applies even when data is synchronously replicated into an RDBMS because replication will obviously fail if the source is down or not accessible.


Fig. 1: Probability that all (data) sources are available given an average availability for a single source.


In a data warehouse (DW), this problem is addressed by regularly and asynchronously copying (extracting) data from the source into the DW. This is a controlled, managed and monitored process that can be made transparent to the admin of a source system who can  then cater for downtimes or any other non-availability of his system. As such, a big problem for one admin - i.e. availability of allsources - is broken down to smaller chunks that can be managed in a simpler, de-central way. Once, the data is in the DW, it is available independent from planned / unplanned downtimes or network failures of the source systems.

Please do not read this blog as a counter argument to federation. No, I simply intend to create awareness for an instance that is solved by a data warehouse and that must not be under-estimated or neglected.

This blog has been cross-published here. You can follow me on Twitter under @tfxz.

DTP loads Vs. ODS activation - a comparative Study

$
0
0

Hi All,


This blog will help you in understanding the relation between DTP loads and ODS request activation in a technical perspective.


ODS request activation will be similar to your delta DTP loads where the delta requests(requests which are not activated) available in the source(New Table) will be processed to target(Active & Change log table) based on Request ID.


Source and Target :DSO activation is also just similar to you DTP load processing where your New table will act as a "Source", your Active table and Change log table will acts as "Targets"

Data Package :Based on your system settings, alike the package size in your DTP settings, you'll be also having package size in DSO activation settings       (refer T-Code: RSODSO_SETTINGS) which will be used to transfer the 'n' records grouped into data packages for processing.

Parallel Processing :Parallel processing in DTP is used to process the data packages in parallel. Similarly Parallel processing in DSO activation also will works.

From the below figure(taken from the RSODSO_SETTINGS) to illustrate Data Package & Parallel Processing,

  • Package size Activation will determines the number of records to be sent in single package(from New table to Active & Change log table).
  • Number of Processes will determines the number of packages to be processed at a time.

For example, If your New table has total number of records = 1,000,000; with this settings => Package size Activation = 50,000; Number of Processes = 4, totally 20 packages (=1,000,000 /50,000) will be created and at a time 4 packages will be processed in parallel.

http://wiki.scn.sap.com/wiki/download/attachments/375128688/Package%20%26%20parallel.png?version=2&modificationDate=1399656580000&api=v2

Request by Request in Delta DTP loads and Do not condense request into Single request in DSO activation : When you select the "get delta request by request" in DTP settings, the delta requests from the source will be processed one after another and it will create separate request ID for each run. Similarly, when you select the "do not condense request into one request while activation takes place" in DSO activation settings, the multiple requests which are waiting for activation will get activated one after another and each request activation will generate new request ID.


To know more in detail about how the ODS activation is working please navigate towiki page

Sharing even more comparisons(if any) which are missed above are much appreciated !!


Thanks,

Bharath S

Multiple SAP BW Landscape Consolidation

$
0
0

Multiple SAP BW Landscape Consolidation! – Perhaps, I heard it for the first time and sounded really rare and ‘not so common’ scenario. The first question that came to my mind was, why one would want to do it – bring multiple BW systems on to a single database, say for example, SAP HANA. Well, the reasons are multifold –


  1. To simplify the landscape
  2. To enable easier maintenance
  3. Comparatively less investment on hardware and software
  4. Software installations/updates, patch updates etc., is just done once
  5. Take advantage of SAP HANA (if you are consolidating on SAP HANA)


There could be more reasons, better reasons. This can typically be like consolidation of regional systems, which is normally spread across geographically into a single landscape. Technically, it’s quite complex, since, the BW Objects like the InfoObjects, DSO, Infocube, Queries etc., when brought together from multiple systems can face overlapping in naming, which has subsequent effects on its own. For example, the infocube 0SD_C03 from one BW system can have issues when 0SD_C03 Infocube from a different BW system want to be moved to the consolidated BW system, especially when both the objects have different characteristics and keyfigurs. The same way with other BW objects as well.


In simple terms, the concept is clear that the technical names of the BW objects need to be exclusive, so that they can be seamlessly consolidated to a single system. But how? Imagining the volume of the BW objects and the intricacies involved in each object, the whole project would truly be massive and humongous.


From the approach point of view, there can be two ways


  1. Superset Approach
  2. Unique Object Renaming Approach


The concept of superset approach is quite simple – Create a single object and include attributes used in all other BW systems, so that we have a single object to cover up all attributes. For example, for the master data 0MATERIAL from BW1 system has attributes attr1, attr2, and attr3. The 0MATERIAL from BW2 system has attributes attr4, attr5, and attr6.  If we were to follow the superset approach for this object, the consolidated BW system will have 0MATERIAL with attributes attr1, attr2, attr3, attr4, attr5 and attr6. Though, this is clear from the object metadata point of view, from the data point of view, it brings up complexity. How? If 0MATERIAL from two different BW systems has same values representing different materials. This basically implies two things.


  1. We can follow the superset approach provided the data is harmonized across the regional BW systems. If this data governance has been followed right, this approach will work fine.
  2. However, if data harmonization has not been taken care, it might need development effort like compounding to 0LOGSYS to the objects to differentiate the data coming from different BW systems. Again, think of the massive effort involved in making this change.


With the Unique Renaming approach, the clarity is more interms of the approach, since, it’s a straightforward renaming of all objects so that the objects from different BW systems, when consolidated, still remains issueless, as they stay unique and exclusive.  But, think of the manual effort to rename the entire set of objects (InfoObjects,DSO, Infocube, MultiProvider, Transformations, Routines, Queries, Process Chains etc.,.) This is quite cumbersome, as manual effort is massive, definitely inefficient and is more prone to errors.


Either way, it’s definitely not a project that’s regular in nature, but requires extreme clarity regarding the complexity of the activities involved and adequate planning and expertise is required to ensure that the consolidated BW system works as before.


My Other Blogs:


http://scn.sap.com/people/sriee.khumar/blog

Some tips to debug DTP-Load into DSO-based SPO

$
0
0


Today I had to debug a data load between 2LIS-Datasource for Billings and a DSO-based SPO. I executed the DTP in debug mode and I wondered why it didn't stop in debug mode. It took me quite a while to find out the reasons. I want to give you some tips, what you should pay attention to.


  1. Identify the Records in PSA and note down billing document number.
  2. Identify target part DSO into which the identified billing documents should have been written to. In my case the SPO is partitioned by country. I had to find out into which part DSO the records will be written. The first billing documents were for Great Britain, others for Poland and some others for Germany. For the erroneous billing documents the Great Britain part DSO was the right one for me.
  3. Create a new DTP between datasource and  target part DSO (e.g. DSO for Great Britain).
  4. Run a test load of this DTP to see how many data packages will be created and if data gets updated into identified part DSO
  5. If you have more then 200 data packages from your test load then you have to assign the correct data package number in DTP settings. In my case the erroneous data came in package number 314 and all other data packages were empty. I started DTP in debug mode, but DTP didn't stop. The reason was that by default data package number in debug mode are restricted from 1 to 200. I deleted all the keys for data package number and entered number 314 only. Then I started debugging again and there was finally the debugger!


I hope this blog is helpfull for you and prevents you from running into the same problems debugging a DTP load into SPO as me.


LO-EXTRACTION - PART1

$
0
0

LO-EXTRACTION

It is the central tool for customizing the LO data source

In LBWE we need to perform the 4 functions

A. Active/Inactive Data Source

B. Maintain Extract Structure

C. Maintain Data source

D. Maintain Update Modes (Direct, Queued, Unsterilized V3 update)

Step1. First we need to select which data source suits the client's requirements in LBWE.

Example: Here I am taking SD Billing as a Logistic Application and 2LIS_13_VDITM as a data source for document Item

Step2. Check the data source 2LIS_13_VDITM whether it is an active version or not.

Go to RSA5 in ECC to activate the data source and then you can find at RSA6.

RSA6

Step3. To do customization we have to inactivate our Extract structure as shown in figure

                A. Active/Inactive Data Source

When you press the Active button as shown in above, you will prompt to customizing request window as shown in below, give the short description and press OK

Then the Extract structure will turn to Inactive stage as shown in below

Step4. Then we need to click on Maintenance to Maintain the Extract Structure as shown in below figure

                B. Maintain Extract Structure

Then you will prompt to customizing request window as like before, give the short description and press OK

Step5. Then you can find the extract structure and communication structure.

Left hand side is Extract structure and Right hand side is Communication Structure.

Drag and drop the extra fields from communication structure to extract structure.

All the must have fields already residing in extract structure will be in blue colour

New fields added from communication structure will be black colour as show in below figure.

If you are not delete the SETUP table before it shows error like below

This mean the fields can’t transfer because of structure change, so you need to delete the structure table.

Step6. To delete SETUP Table Go to SE14

Note: 2 ways deleting the SETUP TABLES

                1.  If you want delete total application use the TCODE - LBWG

                2. If you want specific SETUPTABLE use the TCODE – SE14 – give the setup table name of data source

Then SETUP TABLE deleted

If you want to see the data in SETUP Table go to RSA3 and enter your data source name and press Extraction button then it shows the no of records. In our case there are 0 data records as we deleted SETUP Table before

Then go to maintenance structure and start moves the fields from communication structure to extract structure as shown in above.

Then Extract Structure turns into red colour and inactive button turns into disable mode like shown in below figure


Step7.Then selects your data source and click on it

C. Maintain Data Source

Then Data source customer version edit window will open.

Select the required fields you want at Info package level from the selection column as shown in below figure then go to data source option on the top of the window and select generate

Then Cockpit window will open, here you can observe that your extract structure turns into yellow colour

Step8.Then you need to activate your extract structure, click on inactivate button and click ok then it turns into activate like shown in below


Step9.Update Mode: There are 3 Types of Update modes are available

  1. Direct Delta  2)Queued Delta  3)Unrealized V3 Update


Direct Delta:

With this update mode, the extraction data is transferred with each document posting directly into the BW delta queue. In doing so, each document posting with delta extraction is posted for exactly one LUW in the respective BW delta queues.


Queued Delta:

With this update mode, the extraction data is collected for the affected application instead of being collected in an extraction queue, and can be transferred as usual with the V3 update by means of an updating collective run into the BW delta queue. In doing so, up to 10000 delta extractions of documents for an LUW are compressed for each DataSource into the BW delta queue, depending on the application.


Unsterilized V3 Update:

With this update mode, the extraction data for the application considered is written as before into the update tables with the help of a V3 update module. They are kept there as long as the data is selected through an updating collective run and are processed. However, in contrast to the current default settings (serialized V3 update); the data in the updating collective run are thereby read without regard to sequence from the update tables and are transferred to the BW delta queue

By default Direct Delta selected, Chose the delta mode depends up on your requirement


Step10.Filling of SETUP Table:

Go to SBIW -> Settings for Application-Specific Data Sources (PI) -> Logistics ->Managing Extract Structures -> Initialization -> Filling in the Setup Table -> Application-Specific Setup of Statistical Data -> SD-Billing Documents - Perform Setup

Select the name of the run and give the time then execute as shown in below figure, then billing documents processing will start

After finish the given time the program will be terminates then you need to press the exit button

Step11.Then go to RSA3 to check the available data, we can see the no of records available and press OK. If you want to show entire data press on display list.


Find the document for LO-EXTRACTION PART 2

LO-EXTRACTION - PART2

Thanks,

Phani.

Flat File Transformation Transport issue

$
0
0

Dear All,


Objective of this post is to understand what happens when you transport the flat file transformation from development server to quality server or from quality server to production. I struggled many times that after moving the flat file transformation successfully still the transformation is not visible in the quality or production server.


Whenever you create a transformation in development server two version will be create in the RSTRAN table.

ScreenHunter_03 Jun. 04 10.51.gif

ScreenHunter_04 Jun. 04 10.52.gif


After moving the flat file transformation to the quality server you should have the similar entries for the transformation, but some times you will be getting only the "T" version.


Doing all kind of transport moves like moving the data marts and datasource first and then moving the transformation or moving all the data marts, datasource & transformations didn't helped to view the transformation in the quality server.


Reason behind the issue is not maintaining the logical system conversion for flat file as we do for the ECC system.


Go-to RSA1 select the Tools menu.


Select the conversion of logical system names and maintain the source system for flat file.

ScreenHunter_05 Jun. 04 11.01.gif

Capture.PNG

Next assign the source system ID to the flat file source system.

Capture2.PNG


Finally by re-importing the transport request, transformations are made visible in the quality system. Please do check the above mentioned steps when you are moving the transport to other landscapes. Now you can see the "A" & "M" version are visible in the RSTRAN Table in quality server.


Hope this post is helpful.

Calculate KPI values for High level view and detailed view using Concatenation+Exception aggregation

$
0
0

This blog will clarify how to resolve the issue related to calculation of KPI for high level view and detailed view

where detailed view is based on drill down of 2 different Infoobjects and this combination is unique key  :-


For Example:

we have a division calculation for one KPI : (Unit charge/Consumption * 100 ).


High level view:


Account
  Determination ID
Unit charge
  Value
ConsumptionUnit charge/Consumption
Commercial
  Customers
275.91000001,872.30014.73642045


Detailed view :

If we drill down on Installation and date output is :

NOTE: Installations 6000359409 is repeated and date 03/31/2014 is also repeated corresponding to different Installation.


Account
  Determination ID
Installation
  Number
To DateUnit charge
  Value
ConsumptionUnit charge/Consumption
Commercial
  Customers
600035930003/31/2014194.690000001172.1000000016.61035748
Commercial
  Customers
600035935903/31/201451.60000000518.600000009.94986502
Commercial
  Customers
600035940902/28/201415.5900000095.5790000016.31111437
Commercial
  Customers
600035940903/31/201414.0300000086.0210000016.30997082

however if we see the sum of last column:


Unit charge/Consumption
16.61035748
9.94986502
16.31111437
16.30997082


Sum is =

59.18130769


If we use Exception aggregation alone , it won't work for example if we aggregate on Installation output will be like below :-


Account
  Determination ID
Installation
  Number
To DateUnit charge
  Value
ConsumptionUnit charge/Consumption
Commercial
  Customers
600035930003/31/2014194.690000001172.1000000016.61035748
Commercial
  Customers
600035935903/31/201451.60000000518.600000009.94986502
Commercial
  Customers
600035940902/28/201429.62000000181.6000000016.31057269
Sum =42.87079519


How to achieve this in BW :-


1. Concatenation:

To achieve this we have to create a new Infoobject of length equal to sum of both these Infoobjects and get concatenated value into this new object :-


2. Exception agreegation

Now apply exception aggregation on

Unit charge/Consumption  calculation based on this new Infoobject


Output will be displayed like below :-


High level view:

Account
  Determination ID
Installation
  Number and Date
Unit charge
  Value
ConsumptionUnit chare/Consumption
Commercial
  Customers
600035930020140331194.690000001172.1000000016.61035748
Commercial
  Customers
60003593592014033151.60000000518.600000009.94986502
Commercial
  Customers
60003594092014022815.5900000095.5790000016.31111437
Commercial
  Customers
60003594092014033114.0300000086.0210000016.30997082


Detailed view :

Account
  Determination ID
Unit charge
  Value
ConsumptionUnit chare/Consumption
Commercial
  Customers
275.91000001,872.30059.18130769

Now sum is matching.

Breaking free from BI (or BW)

$
0
0

BI_small.jpgSooo, have you thought about buying HANA? Ha-ha, just kidding! No, folks, this is not another sales pitch for HANA or some expensive “solution”, but a simple customer experience story about how we at Undisclosed Company were able to break free from the BI (*) system with no external cost while keeping our users report-happy. Mind you, this adventure is certainly not for every SAP customer (more on that below), so YMMV. The blame, err… credit for this blog goes to Julien Delvat who carelessly suggested that there might be some interest in the SAP community for this kind of information.


It might be time to part with your BI system if…


… every time you innocently suggest to the users “have you checked if this information is available in BI?” their eyes roll, faces turn red and/or they mumble incoherently what sounds like an ancient curse.

… you suspect very few users actually use the BI system.

… your have a huge pile of tickets demanding an explanation why report so-and-so in BI doesn’t match report so-and-so in SAP.

… your whole BI team quit.

… the bill for BI maintenance from your hosting provider is due and you can think of at least 10 better things to do with that money.


What went into our strategic decision


  • Tangible cost to run BI. Considering number of active users and value, we were not getting our money’s worth.
  • Relatively small database size. The Undisclosed Company is by no means a small mom-and-pop shop but due to the nature of our business we are fortunate to have not as many records as, say, a big retail company might have.
  • Reports already available in SAP. For example, it just happened that few months before the “BI talk” even started our financial team already made a plea for just one revenue report in SAP that they could actually rely on. Fortunately, we were able to give them all the information in (gasp!) one SQ01 query.
  • No emotional attachment to BI. As far as change management goes, we had the work cut out for us (see the eye rolling and curse-mumbling observation above). The users already hated BI and SAP team didn’t want anything to do with it either.


We're doing it!


Personally I have suggested that we simply shut down BI and see who screams, but for some reason this wasn’t taken by the management with as much excitement as I was expecting.


Instead we took a list of the users who logged into BI in the past few months (turned out to be a rather small group) and our heroic Service Delivery manager approached all of them to find out what reports they’re actually using in BI and how did they feel about it. Very soon we had an interesting matrix of the users and reporting requirements, which our SAP team began to analyze. Surprisingly, out of the vast BI universe the users actually cared about less than 15 reports.


For every item we identified a potential replacement option: an existing report in SAP (either custom or standard), a new query (little time to develop), a new custom ABAP report (more time to develop). With this we were able to come up with a projected date for when we could have those replacements ready in SAP and therefore could begin the BI shutdown. It was an important step because having a specific cut-off date puts fear into the users’ minds. Otherwise if you come asking them for the input or testing and no specific due date we all know it’s going to drag forever (there seems to be always “end of month” somewhere!).


Drum roll, please


So what did 15 BI reports come down to in ECC? We actually ended up with just 2 custom ABAP reports and 2 new queries, everything else was covered by standard SAP reports and just a couple of existing custom reports. Interestingly, we discovered that there were sometimes 3 different versions of essentially the same report delivered as 3 different reports in BI. In those cases we combined all the data into one report/query and trained the users on how to use the ALV layouts.


The affected functional areas were Sales, Finances and QM (some manufacturing reports were and are provided by our external MES system). There was very little moaning and groaning from the user side - it was definitely the easiest migration project I’ve ever worked on. Breaking free from BI felt like a breeze of fresh air.


Are you thinking what I’m thinking?


If you’ve already had doubts in the BI value for your organization or this blog just got you thinking “hmm”, here are some of our “lessons learned” and just random related observations and suggestions. (Note – HANA would likely make many of these points obsolete but we have yet to get there.)

  • If you feel you don’t get adequate value from your BI system it is likely because you didn’t really need it in the first place.
  • If you are already experiencing performance issues in the “core” SAP system, you might want to hold on to your BI for a bit longer (unless it’s BI extraction that is causing the issues). Adding more reporting workload to the already strained system is not a good idea.
  • Find the right words. If we just told our business folks that we’re shutting down BI the hell would break lose (“evil IT is taking away our reports!!!”). But when you start conversation with “how would you like to get a better report directly from SAP?” it’s a different story. And don’t forget to mention that they will still be able to download reports into Excel. Everybody loves Excel!
  • Always think ahead about your reporting needs. I can’t stress this point enough. For example, in our scenario one of the reporting key figures is originally located in the sales order variant configuration. If you’ve never dealt with VC, let me tell you – good luck pulling this data into a custom report. (The same problem with the texts, by the way – makes me shiver when some “expert” suggests on SCN to store any important data there). So our key VC value was simply copied to a custom sales order (VBAP table) field in a user exit. Just a few lines of code, but now we can easily do any kinds of sales reports with it. It only took a couple of hours of effort but if you don’t do it in the beginning, down the line you’ll end up with tons of data that you cannot report on easily.
  • Know your SAP tables. Many times custom SAP reports get a bad rep because they are simply not using the best data sources. E.g. going after the accounting documents in BSEG is unnecessary when you can use index tables like BSAD/BSID and in SD you can cut down on the amount of data significantly if you use status tables (VBUK/VBUP) and index tables like VAKMA/VAKPA. I’m sure there are many examples like that in every module – search for them on SCN and ask around!
  • Queries (SQ01) are awesome! (And we have heaps of material on SCN for them - see below.) If you have not been using them much, I’d strongly encourage you to check out this functionality. You can do authorization checks in them and even some custom code. And building the query itself takes just a few button clicks with no nail-biting decisions whether to use procedural or OO development. SAP does everything for you – finally!
  • Logistics Info System (LIS)  – not so much. Even though I wouldn’t completely discount it as an option for reporting (yet), it is usually plagued by the same problems as BI – inconsistent updates and “why this report different from that report” wild goose chase.
  • When it comes to reports – “think medium”. You’ve probably noticed that in our case number of reports reduced greatly in SAP compared to BI. Why was that? Turned out that we had many reports that essentially used the same data but were presenting it slightly differently. There is no need to break up the reports when display customization can be easily achieved by using the ALV layouts, for example. And on the other side of the spectrum are the “jumbo reports” that include data from 4 different modules because someone requested the report 10 years ago and thought it was good, so he/she told other users about it and other users liked it too BUT they needed to add “just these two fields” to make it perfect, then more and more users joined this “circle” and everyone kept asking for “just these two fields” but nothing was getting removed because the first guy left the company years ago and now no one even remembers what the original requirement was. So you end up with the ugly Leviathan of a report that has to be sent to the farm upstate eventually. Try to avoid those.
  • Be creative. If a “jumbo report” cannot be avoided (ugh!), you might want to consider creating a “micro data warehouse” in a custom table that can be populated in a background job daily (or more frequently, if needed). Such reports usually do not require up to the second information and we can get the best of both worlds – minimize impact on performance by pre-processing the data and allow the users to run the reports on their own. Another tip – if a report is used by different groups of users and includes certain fields that are more time-consuming than others, you can add an option to selection screen to exclude those fields when they’re not needed. Also simple training the users on ALV functionality can be very helpful. For example, we noticed that some users ran a report for one customer, then went back to the selection screen and ran it for another. But running the report for two customers and then using ALV filter would actually be more efficient.
  • Don’t let the big picture intimidate you. The big goal of taking down a large (as we thought!) productive system seemed pretty scary in the beginning, but, as you could see, we broke it down into pieces and just got it down one by one. And this was done by the team of just 5 people in 3.5 months while supporting two productive SAP systems and handling other small projects as well. If we did it, so can you!


Useful links


Next Generation ABAP Runtime Analysis (SAT) – How to analyze performance - great blog series on the SAT tool. My weapon of choice is still good old ST05, but in some cases it might be not enough.

There are many SCN posts regarding ABAP performance tuning, although quality of the posts varies greatly. This wiki page could be a good start, use Google to find more. Look for the newer/updated posts from the reputable SCN members. (Hint – I follow them! )

Some tips on ABAP query - this is Query 101 with step by step guide, great for the beginners.

10 Useful Tips for Infoset Queries - good collection of miscellaneous tips and tricks

Query Report Tips Part 2 - Mandatory Selection Field And Authorization Check - great tip on adding a simple authority check to a query.


(*) or BW? – I’m utterly confused at this point but had the picture already drawn so let’s just stick with BI

BW 7.4 Upgrade issue - Data model Synchronization error

$
0
0


The purpose of this document is to help people who have BCS component installed in their landscape along with BW during BW upgrade. As, I have to do a thorough research before I came across the solution I thought of sharing it in a blog so that ,in future, if anyone faces the similar problem he/she can refer this blog. So, Lets look at the problem that my team faced during upgrade and what we did it to resolve it..


Recently, we did an upgrade in our BW environment form 7.0 to 7.4. During our BW post upgrade activities, we found error in one of our Bex query as shown below:

dms_error.png


This Bex query was built on top of BCS cube. BCS is a SEM component based on BW. The Strategic Enterprise Management (SEM) is a SAP product that provides integrated software with comprehensive functionality that allows a company to significantly streamline the entire strategic management process.The BCS component is a part of SEM that provides complete functionality for the legally required and management consolidation by company.


Upon choosing the Individual display from the above error message we got below screen. This is the Data Model Synchronizer screen which highlights the difference in the data models between BCS and BW application. Here, in field MSEHI we can see that the difference exists between BCS and BW landscape as shown below which is the root cause for this issue.

dms_error.png

So to resolve this issue, we tried to follow the details in the message as shown  in the window below,but with that every object(Cube,DSO etc) built on top of BCS got regenerated in BW. Due to which, all the existing modifications done in the these objects by BW team got lost.

dms_error.png

So, in order to avoid that, we used program 'UGMD_BATCH_SYNC'. This program synchronized BW and BCS application without regenerating any thing. The details of this program can be found at below link:


Manual Data Synchronization - Business Consolidation (SEM-BCS) - SAP Library.


After executing this program, we need to mentioned the following things:


  • Application
  • Application Area
  • Field name


Application and application area can be found out as highlighted below:

dms_error.png

We executed this program with selections as shown below and both the applications got synchronized without the regeneration of any of the BW objects.dms_error.png


Viewing all 333 articles
Browse latest View live


<script src="https://jsc.adskeeper.com/r/s/rssing.com.1596347.js" async> </script>